
Data released last week finds the labor market held firm, but not necessarily improved, during the final days of 2016. Here are the 5 things we learned from U.S. economic data released during the week ending February 10.
 Both the count of job openings and the pace hiring held steady in December. Per the Bureau of Labor Statistics, there were 5.501 million job openings on a seasonally adjusted basis at the end of December, virtually unchanged from November but up 4.2% from a year earlier. Private sector job openings totaled 5.017 million, 4.8% above the December 2015 count. Industries reporting large percentage gains in job openings included wholesale trade (+34.3%), retail (+22.9%), construction (+19.4%), and health care/social assistance (+12.0%). Employers hired 5.252 million workers during December, up 40,000 from November but off 2.8% from a year earlier. The private sector was responsible for 4.931 million of the people hired during the month (-2.2% vs. December 2015). Industries with large positive percentage gains in hiring included construction (+20.5%), wholesale trade (+3.9%), manufacturing (+3.3%), and health care/social assistance (+2.2%). 4.969 million people left their job during December, down 50,000 from November and off 3.1% from a year earlier. 2.507 million people voluntarily left their job in December (-3.7% vs. December 2015) while layoffs totaled 1.822 million during the month (-1.2% vs. December 2015).
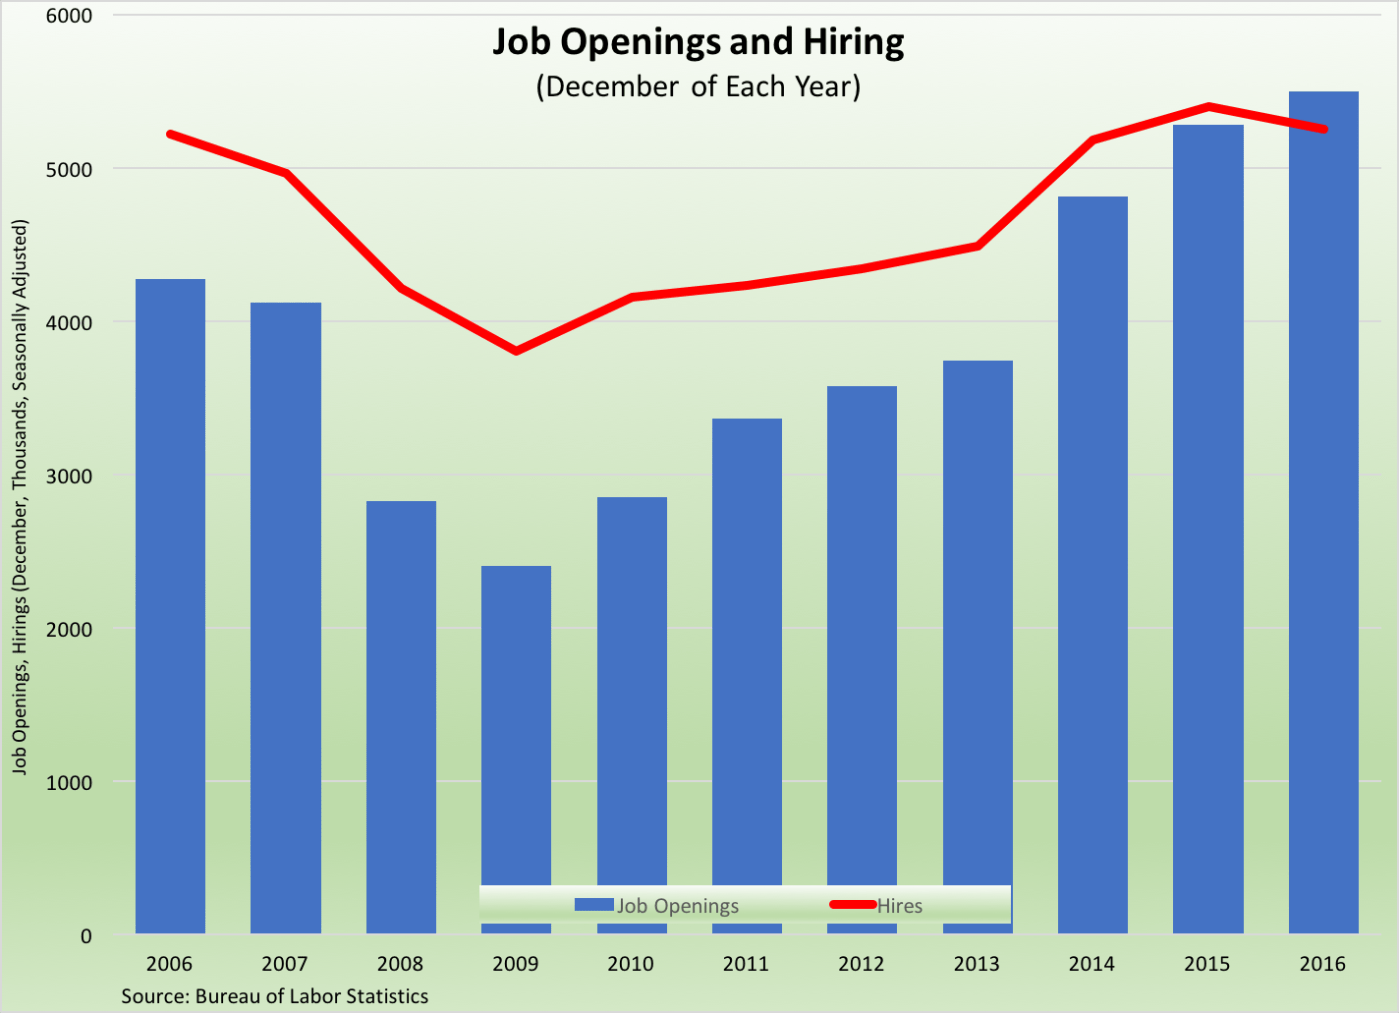
 The trade deficit narrowed slightly in December. The goods and services deficit shrank by $1.5 billion during the month to -$44.3 billion per the Bureau of Economic Analysis/Census Bureau. Even with the contraction, this was the 3rd consecutive month in which the deficit was larger than -$40 billion. Exports grew by $5.0 billion to $190.7 billion (+4.2% vs. December 2015 and its highest point since August 2015) while import activity increased by $3.6 billion to $235.0 billion (+4.6% vs. December 2015 and its highest reading since December 2014). In comparison to November, exports grew for capital goods (including for civilian aircraft) and industrial supplies/materials (including natural gas and fuel oil). Imports increased during the month for passenger cars, industrial supplies/materials (including natural gas and fertilizers/pesticides/insecticides), and capital goods. The U.S. had its largest goods deficits with China (-$30.2 billion, European Union (-$12.9 billion), Japan (-$6.8 billion), Germany (-$5.2 billion), and Mexico (-$4.6 billion).
 Rising energy prices pulled up import prices during January. The Bureau of Labor Statistics reports that import prices grew 0.5% during the month following a 0.1% decline during the prior month. Prices for fuel imports jumped 5.8%, with gains of 12.2% and 5.2% for imported natural gas and petroleum, respectively. Net of fuel, import prices decreased 0.2% during January, the 5th straight month in which core import prices failed to increase. Pulling down nonfuel import prices were declining prices for foods/feeds/beverages and every major category of finished goods. Import prices have grown 3.7% over the past year while the prices for nonfuel imports matched those of January 2016. Meanwhile, export prices edged up 0.1% during January and were 2.3% above their year ago levels. While prices for agricultural exports slipped 0.1% during the month, prices grew for both exported nonagricultural supplies/materials and vehicles.
 The pace of growth in consumer credit balances slowed during December. Outstanding consumer credit loan balances (not including mortgages and other real estate-backed loans) grew by $14.2 billion during the month to $3.763 trillion. This followed a $25.2 billion gain in the Federal Reserve measure in November and was 6.2% above its December 2015 mark. Non-revolving credit balances (e.g., college loans, car loans), grew by $11.8 billion to $2.727 trillion (+6.5% vs. December 2015). Revolving credit balances increased at a slower rate, rising $2.4 billion to $995.5 billion. Even with the slower pace of growth during December, outstanding revolving credit balances were up 6.2% from a year earlier.
 Banks maintained lending standards on most commercial and consumer loans during the final months of 2016. The Federal Reserve’s January 2017 Senior Loan Office Survey on Bank Lending Practices finds 92.8% of banks had kept their lending standards “basically unchanged” for their large and middle-market commercial & industrial (C&I) customers. More specifically, 16.7% had increased the maximum size of credit lines, 23.8% had narrowed the spread between their loan rates and their cost of funds, 16.7% had eased loan covenants, and 12.5% lessened their use of interest rate loans. 64.3% of banks reported that the demand for C&L loans from large and medium-sized customers was “about the same,” with 16.7% saying the demand was stronger and 19.1% saying it had weakened. On the residential side, 94.3% of banks indicated that their credit standards for GSE-backed residential mortgages (e.g. Fannie Mac, Freddie Mac) had “remained essentially unchanged, with similar percentages of banks reporting the same for other mortgage types. 51.4% of banks reported that the demand for GSE-eligible residential mortgages was “about the same,” with 20.0% indicating an increase in demand and 28.6% reporting “moderately” weakened demand.
Other U.S. economic data released over the past week:
– Jobless Claims (week ending February 4, 2017, First-Time Claims, seasonally adjusted): 234,000 (-12,000 vs. previous week; -25,000 vs. the same week a year earlier). 4-week moving average: 244,250 (-12.1% vs. the same week a year earlier).
– Wholesale Inventories (December 2016, Merchant Wholesale Inventories, seasonally adjusted): $601.1 billion (+1.0% vs. November 2016, +2.6% vs. December 2015).
– Treasury Budget (January 2017, Surplus/Deficit): +$51.3 billion (vs. January 2016: +$55.2 billion). For the 1st 4 months of FY17: -$156.9 billion (vs. 1st 4 months of FY16: -$160.4 billion).
– University of Michigan Index of Consumer Sentiment (February 2017-preliminary, Index (1966Q1 = 100, seasonally adjusted): 85.7 (vs. January 2017: 85.3, vs. February 2016:
The opinions expressed here are not necessarily those of Kevin’s current and previous employers. No endorsements are implied.
