
An upgrade for GDP, lukewarm consumer spending and sentiment. Here are the 5 things we learned from U.S. economic data released during the week ending November 27.
 The U.S. economy expanded at a faster pace than previously believed during Q3, although the pace was nothing to write home about. The Bureau of Economic Analysis now puts the seasonally adjusted annualized rate (SAAR) of growth of Gross Domestic Product (GDP) at +2.1%, up from the +1.5% estimate reported in late October. The major source for the higher GDP estimate was a smaller than previously believed reduction in private inventories. Nevertheless, the $23.3 billion contraction in private inventories remained the biggest drag on economic expansion during the quarter (costing 59-basis points in GDP growth). Continued weakness in exports translated in net exports costing
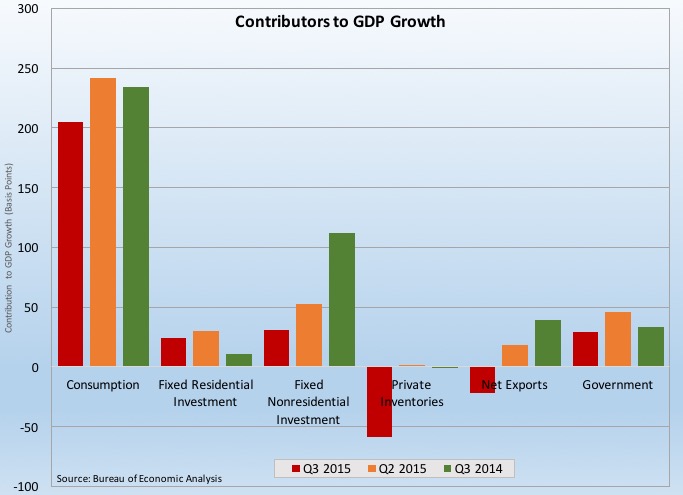
 another 22-basis points in economic growth. On the other end of the spectrum, the biggest contributors to Q3 GDP growth were consumption (+205-basis points in GDP growth), fixed investment (+54-basis points) and government expenditures (+29-basis points). This revision to GDP report also included the 1st estimate of Q3 corporate profits and the story was not good. The SAAR estimate of corporate profits from current production of $2.060 trillion was down 1.1% from Q2 and 4.7% from the same quarter a year ago. The BEA will revise its estimates of Q3 GDP and corporate profits once again at the end of December.
 While the largest contributor to GDP growth, consumer spending was stuck in low gear for a 2nd straight month in October. The BEA estimates “real” Personal Consumption Expenditures (PCE) were at a seasonally adjusted annualized rate (SAAR based on 2009 dollars) of $11.293 trillion during the month, up a mere 0.1% for the month and 2.7% from October 2014 levels. Spending on goods grew 0.2%, boosted by gains of 0.2% and 0.1% for durable and nondurable goods, respectively. Spending on services was unchanged for the month. The 12-month comparables for real spending on goods and services was +4.8% and +2.2%, respectively. Without adjustments for price variation, consumption was up 0.1% for the month and 3.0% from the same month a year earlier. The modest increase in spending was funded by a 0.4% bump in nominal personal income (with wages up 0.6% during the month). The savings rate grew by 3/10ths of a percentage point to +5.6%, its highest reading in nearly 3 years.
 Mixed housing picture in October: existing home sales chilled while those of new homes rebounded. The National Association of Realtors estimates sales of previously owned homes slowed 3.4% during the month to a seasonally adjusted annualized rate (SAAR) of 5.36 million units. This was up 3.9% above the October 2014 rate and the 8th straight month in which the sales pace was above 5 million units SAAR. Sales failed to grow during the month in any of the 4 Census regions, but the 12-month comparables were positive in all 4 regions. Inventories of unsold homes remain tight: the 2.140 million homes for sale at the end of October was off 2.3% from September, 4.5% below the October 2014 count and represented a slim 4.8 month supply. The press release linked October’s weakness to tight inventories, “ongoing affordability concerns” in some markets and “mixed signals of economic slowing.”
New home sales rebounded 10.7% during October to a SAAR of 495,000 units (+4.9% vs. October 2014). The Census Bureau has new home sales up in 3 of 4 Census regions during the month (with the West being the exception) and in 2 of 4 Census regions versus a year earlier (with the Northeast and South seeing year-to-year gains). (Note that the NAR’s existing home sales series tracks actual closings while new home sales measures contract signings.) Inventories of unsold homes grew 1.3% during October to 226,000 units (+8.7% vs. October 2014), a 5.5 month supply.
 Consumer sentiment has little forward momentum as the year winds up. The Conference Board Consumer Confidence Index slumped 8.7 points during November to a seasonally adjusted 90.4 (1985 = 100), its lowest reading since September 2014. The present conditions index dropped 6.5 points to 108.1 (its worst since July) while the expectations index lost 10.1 points to 78.6 (its worst since February 2014). Fewer survey respondents saw current economic conditions as “good” while the percentage seeing current conditions as “bad” expanded. Similarly, fewer consumers expect conditions will improve over the short-term, with survey respondents also less sanguine about expected labor market conditions. The press release noted that survey respondents were cautious about the labor market and expected little change in business conditions” in 2016.
While the Index of Consumer Sentiment from the University of Michigan was up 1.3 points during the month to 91.3 (1966 Q1 = 100), it represented a downward revision of 1.8 points from the preliminary November reading reported a few weeks ago. The current conditions index added 2.0 points to 104.3 while the expectations measure added 8/10ths of a point to 82.9. The headline, current conditions and expected conditions indices were all at their highest points since August. The press release noted that November’s gains largely came from middle and lower income households as “confidence retreated among households with incomes in the upper third of the distribution.”
 Durable goods orders jumped in October, with aircraft order gains explaining much (but not all) of the increase. The Census Bureau indicated that new orders for manufactured durable goods gained 3.0% to a seasonally adjusted $239.0 billion (+0.5% vs. October 2014). Orders for transportation orders jumped 8.0% with orders for civilian aircraft surging 81.0% (motor vehicles new orders slowed 2.9%). Net of transportation goods, durable goods orders increased 0.5% during the month but remained 2.4% below year ago levels. Business investment—a measured by civilian capital goods orders net of aircraft—rose 0.5% in October, its 4th increase over the past 5 months. Shipments fell for the 2nd time in 3 months, with a 1.0% drop to $240.1 billion (SAAR). Unfilled orders expanded after 2 straight monthly drops (+0.3%) while inventories contracted for the 5th time in 6 months (-0.2%).
Other data released over the past week that you might find of interest:
– Jobless Claims (week ending November 21, 2015, seasonally adjusted): 260,000 (-12,000 vs. previous week; -43,000 vs. same week a year earlier). 4-week moving average: 271,000 (-7.1% vs. same week a year earlier).
– Chicago Fed National Activity Index (October 2015): -0.04 (+25-basis points vs. September 2015). 3-mo. moving average: -0.20 (-17-basis points vs. September 2015, -250-basis points vs. October 2014).
– Case-Shlller Home Price Index (September 2015, 20-city index, seasonally adjusted): +0.6% vs. August 2015, +5.5% vs. September 2014.
The opinions expressed here are not necessarily those of Kevin’s current and previous employers. No endorsements are implied.
